OTE Pattern Recognition Series - Vol. 01
New Section
In this video, the speaker introduces a series of videos aimed at training viewers to identify optimal trade entry points in the market. The content is not intended to provide signals or specific predictions but rather to activate the viewer's ability to recognize patterns and formations in price action.
Introduction and Purpose
- The speaker acknowledges the current global conditions due to an illness and aims to provide inspiration and guidance through their YouTube channel.
- The purpose of the video series is to train viewers' eyes to see optimal trade entry points in various formations and nuances.
- It is emphasized that this is not a signal service but rather an opportunity for viewers to develop their skills in recognizing patterns.
Optimal Trade Entry
- The concept of optimal trade entry (OTE) is introduced as an old staple in trading.
- Viewers are encouraged to watch the OTE primer video if they are unfamiliar with this concept.
- The speaker mentions that the videos will not be lengthy, aiming to get straight to the point within each 5-minute segment.
Training Your Eye
- The goal of the videos is explained as training viewers' eyes to see specific patterns and formations in price action.
- The speaker shares personal experience from the 1990s when they trained themselves by looking at charts and annotating them.
- Annotating charts helps build familiarity with specific patterns over time, even if they were not observed live.
Focus on Optimal Trade Entry
- It is clarified that these videos will focus solely on optimal trade entry and will not cover topics such as bias or finding order blocks.
- Viewers are encouraged to use these videos as a baseline for their own chart annotations, adding attention to other important factors based on their unique price action model.
Importance of Repetition
- The importance of repetition in learning is highlighted, with a recommendation for studying these concepts for at least a month.
- Over time, repeated exposure to the material helps it take root in memory and identification.
Reticular Activating System
- The concept of the reticular activating system is explained as the brain's ability to filter information based on what is meaningful or important to an individual.
- By repeatedly showing examples of specific patterns and signatures, viewers can activate their own reticular activating systems to identify these patterns in real-time.
Progression and Confidence
- As viewers become more familiar with the patterns through repetition, they can gain confidence in identifying them.
- The speaker suggests progressing from demo trading to live trading with a small amount of money if consistent results are achieved over six months.
Focus of the Video Series
- It is emphasized that the video series will solely focus on optimal trade entry and not cover other topics.
- Viewers are directed to watch the optimal trade entry primer video before diving into this series.
- A playlist will be created for easy access to all twenty videos in the series.
New Section
In this section, the speaker concludes their introduction by addressing viewers who are serious about understanding the concepts presented in their YouTube channel. They provide information about accessing resources related to optimal trade entry and emphasize their commitment to delivering concise videos within five minutes or less.
Commitment to Understanding
- Viewers who are genuinely interested in understanding the concepts presented on the YouTube channel are addressed directly.
- The optimal trade entry is highlighted as one of the hallmarks of this channel's content.
Optimal Trade Entry Primer Video
- Viewers are reminded once again to watch the optimal trade entry primer video before proceeding with this series.
- This primer video serves as a foundation for understanding key concepts related to optimal trade entry.
Playlist for Easy Access
- A playlist will be created specifically for this video series, making it easier for viewers to find and access all twenty videos.
Conclusion
The speaker introduces a video series aimed at training viewers to identify optimal trade entry points in the market. The content is not intended to provide signals or specific predictions but rather to activate the viewer's ability to recognize patterns and formations in price action. Viewers are encouraged to watch the optimal trade entry primer video before diving into this series, which will consist of concise videos within five minutes or less.
Optimal Trade Entry and Formation
In this section, the speaker discusses the importance of studying optimal trade entry and formation on a daily basis. They emphasize the need for methodical and patient learning, as well as the significance of identifying key patterns in price action.
Understanding Optimal Trade Entry
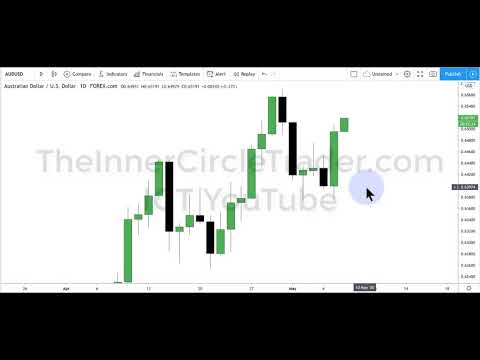
- The speaker recommends using forex.com to view price action in order to align with their presentation.
- Studying optimal trade entry should be done on a day-by-day basis, focusing on reactions from previous day's range.
- It is important to note that this is not about promoting day trading every single day but rather understanding the process gradually.
- Familiarity with optimal trade entry requires a minimum of four weeks of daily study.
- Each individual's learning timeline may vary, so it is crucial not to compare oneself with others.
Identifying Order Blocks
In this section, the speaker introduces the concept of order blocks and their significance in determining optimal trade entry. They explain how these order blocks can serve as reference points for future trades.
Identifying Order Blocks
- An order block refers to a specific area where price action shows sensitivity or reacts strongly.
- The speaker highlights an example where two consecutive down close candles form an order block.
- Understanding order blocks becomes essential for subsequent discussions and videos related to optimal trade entry.
Importance of Previous Day's Range
This section emphasizes the importance of analyzing the previous day's range when studying price action. The speaker explains how observing reactions within this range can provide valuable insights for making informed trading decisions.
Analyzing Previous Day's Range
- Price action on a daily chart focuses on reactions within the previous day's range.
- Hindsight should be set aside when studying patterns since all learning involves looking at past examples.
- By identifying and understanding patterns, one can develop their personal trading model without relying on indicators or external sources.
- The speaker discourages copying others' trades and emphasizes the importance of independent thinking.
Studying Candle Ranges
This section delves into studying candle ranges within the previous day's range. The speaker explains how identifying highs and lows can provide valuable insights into market behavior.
Studying Candle Ranges
- Analyzing candle ranges within the previous day's range is crucial for understanding market behavior.
- The speaker highlights a specific candle's high as an important reference point.
- Price action dipping into the candle range indicates a lack of willingness to go deeper, suggesting a potential upward movement in the market.
- Taking notes and maintaining a study journal focused on optimal trade entry is recommended.
Focus on Intraday Charts
In this section, the speaker discusses the importance of focusing on intraday charts, specifically a five-minute chart. They explain that over the next twenty days, they will provide additional facets to enhance understanding of optimal trade entry.
Importance of Intraday Charts
- Over the next twenty days, the focus will be on intraday charts, particularly a five-minute chart.
- Through this study, participants will gain further insights and develop a deeper understanding of optimal trade entry.
- Even those familiar with optimal trade entry may discover new aspects through this comprehensive study.
Timestamps have been associated with bullet points as requested.
New Section
In this section, the speaker discusses the importance of previous day's highs and lows in trading decisions.
Focusing on Previous Day's Highs and Lows
- The speaker explains that above previous day's highs and below previous day's lows, there is a bank of orders in the marketplace.
- When the market has a predisposed bias or trend, it is important to focus on the previous day's high.
- If the market goes through the previous day's high, it can lead to missed opportunities or explosive moves.
- It is advised not to get upset about missed trades but instead focus on following the adopted method and analyzing price action.
New Section
This section continues discussing trading strategies based on previous day's highs and lows.
Analyzing Previous Day's Highs and Lows
- Traders want to see if the market goes up above previous day's highs or below previous day's lows.
- If bullish, traders want to see if price can reach up to the previous day's high.
- Two possible outcomes when price reaches the previous day's high: it either goes through and explodes or fails to break through.
- Negative self-talk after missing a trade can lead to stress and anxiety in future trades. It is important to focus on following the method instead.
New Section
This section delves deeper into analyzing formations around previous day's highs and lows.
Formations Around Previous Day's Highs/Lows
- Traders often encounter formations similar to what is being shown in this example across different currencies.
- Understanding these patterns allows traders to mark out their own levels for previous day's highs and lows.
- By filtering out other currencies, traders can focus on one or two specific currencies for a trading day.
- The speaker emphasizes the importance of optimal trade entries when price trades to and through the previous day's high or low.
New Section
This section discusses how to filter currencies and focus on specific ones based on discernible directional biases.
Filtering Currencies Based on Directional Bias
- Traders can easily filter out currencies by identifying discernible directional biases.
- By focusing on one or two specific currencies, traders can wait for price to trade to and through the previous day's high or low.
- The speaker suggests fleshing out these ideas further and paying attention to key levels such as mid figures and institutional levels.
New Section
This section provides additional details about key levels in trading decisions.
Key Levels in Trading Decisions
- Mid figure levels (e.g., 6450) and institutional levels (e.g., 80) are significant in trading decisions.
- Large fund traders often place their orders at these levels, making them important areas of liquidity.
- Global commerce also contributes to activity at these levels, as large transactions require currency conversions.
Timestamps have been associated with bullet points where available.
New Section
In this section, the speaker discusses the importance of studying price action patterns on a daily chart and how they can indicate bullish or bearish market conditions.
Why Price Forms Here
- The previous day's high should be traded to confirm a bullish market.
- If the price goes below the previous day's low, it indicates a less bullish sentiment.
- The speaker emphasizes the importance of studying these patterns daily to train one's eye.
New Section
In this section, the speaker explains that trade entry decisions should be based on whether the previous day's low has been violated. They emphasize the importance of following rule-based strategies rather than trying to guess market movements.
Importance of Rule-Based Strategies
- Trade entry decisions should be based on whether the previous day's low has been violated.
- Following rule-based strategies helps in developing discipline and focus.
- Professional traders stick to their trading plans and do not deviate based on luck or intuition.
New Section
In this section, the speaker reiterates that their examples are meant to train viewers' eyes to recognize recurring patterns in price action. They emphasize that these patterns are not specific to one market but can be observed in other markets as well.
Training Your Eye for Price Action Patterns
- Examples are provided to help viewers recognize recurring patterns in price action.
- These patterns can be observed across different markets, not just limited to one specific market.
New Section
In this section, the speaker analyzes an example where the previous day's high is traded and then consolidates before breaking above it. They explain how orders get accumulated during consolidation periods.
Accumulation of Orders during Consolidation
- After trading above the previous day's high, the price consolidates and retraces slightly.
- Once it hits a specific level (6450 in this example), it breaks out above the previous day's high.
- The price then retraces to the mid-figure (6450) and consolidates between 6466 and 6450.
- This consolidation allows accumulated orders around 6450 to be filled.
New Section
In this section, the speaker discusses how price action creates runs above the previous day's high, depleting orders in that area. They explain that these orders influence market sentiment.
Depletion of Orders and Market Sentiment
- Price creates a run above the previous day's high with a more meaningful run than before.
- The shallow run is overtaken by a deeper run, indicating increased bullishness.
- Price returns to the mid-figure (6450) and consolidates, allowing accumulated orders to be depleted.
- Accumulated orders influence market sentiment regarding bullish or bearish expectations for the Australian dollar.
New Section
In this section, the speaker explains the concept of an "order bank" as a collection of orders that may or may not be present in the market. They discuss how order banks build up over time during consolidation periods.
Understanding Order Banks
- An order bank refers to a collection of orders that may or may not be present in the market.
- During consolidation periods, traders start building biases or sentiments based on these order banks.
- Orders accumulated within a consolidation range can influence future market movements.
New Section
In this section, the speaker emphasizes that optimal trade entry is not just about price retracements but also about specific times during the New York session. They highlight that this approach requires discipline and adherence to rule-based strategies.
Optimal Trade Entry and Specific Times
- Optimal trade entry is not solely based on price retracements.
- It also considers specific times during the New York session (8:30 am to 11:00 am).
- This approach requires discipline and adherence to rule-based strategies.
- The speaker clarifies that they are not teaching ICT kill zones but focusing on specific time windows during the New York session.
New Section
In this section, the speaker explains that if the optimal trade entry pattern does not occur within the specified time window, it should not be traded. They emphasize the importance of sticking to a trading plan and avoiding impulsive decisions.
Importance of Sticking to Trading Plan
- If the optimal trade entry pattern does not occur within the specified time window, it should not be traded.
- Impulsive decisions based on luck or intuition can lead to confusion and losses.
- Professional traders stick to their trading plans and follow rule-based strategies.
New Section
In this section, the speaker discusses how learning to recognize optimal trade entry patterns can help traders identify recurring opportunities in price action. They highlight that losses are inevitable but can be managed through proper understanding and application of these patterns.
Recognizing Recurring Opportunities
- Learning to recognize optimal trade entry patterns helps identify recurring opportunities in price action.
- Losses are inevitable in trading, but proper understanding of these patterns can help manage them effectively.
- Traders need to develop a disciplined approach based on rule-based strategies.
New Section
In this section, the speaker explains how price meanders up and down until it reaches a specific time of day (8:30 am to 11:00 am New York time). They clarify that this time window is specific to their price action model and not related to ICT kill zones.
Specific Time of Day for Optimal Trade Entry
- Price meanders up and down until it reaches a specific time of day (8:30 am to 11:00 am New York time).
- This time window is specific to the speaker's price action model, not related to ICT kill zones.
- Traders need to adjust the time window according to their local timezone if different from New York.
New Section
In this section, the speaker explains the importance of using Fibonacci levels in conjunction with the optimal trade entry pattern. They emphasize that these levels should be consistent and not manipulated for winning trades.
Using Fibonacci Levels with Optimal Trade Entry
- Fibonacci levels (62% tradesman level, 17% trace on level, and mid-point or 70.5 level) are used in conjunction with the optimal trade entry pattern.
- These levels should be consistent and not manipulated for winning trades.
- The speaker highlights that their fib levels do not change or fit into winning trades but are part of a specific strategy.
New Section
In this section, the speaker emphasizes that losses are inevitable in trading but can be managed through proper understanding and application of the optimal trade entry pattern. They encourage viewers to observe how frequently this pattern occurs in price action.
Managing Losses through Understanding
- Losses are inevitable in trading; even experienced traders incur losses.
- Proper understanding and application of the optimal trade entry pattern can help manage losses effectively.
- Observing how frequently this pattern occurs in price action helps develop familiarity with its significance.
New Section
In this section, the speaker clarifies that the specified time window for optimal trade entry is based on New York time. They explain that their focus is on teaching a specific price action model with rule-based ideas, not ICT kill zones.
Clarification on Time Window
- The specified time window for optimal trade entry (8:30 am to 11:00 am) is based on New York time
New Section
The speaker discusses a trading strategy that involves identifying institutional price levels based on the previous day's high. They explain how to determine the range and time frame for optimal trade entries.
Identifying Institutional Price Levels
- Determine the previous day's high (e.g., 64.50) and create an envelope of 10 pips above and below it.
- Allow price to generate a trading range between these levels until a specific time frame.
- The time frame is from 8:30 in the morning until 11 o'clock, during which significant news often comes out.
Determining Optimal Trade Entry
- For bullish trades, look for price to trade down into the 62% to 79% Fibonacci retracement level.
- Use the fib drawing tool to identify the range from the low to the high of the previous day.
- Set a short-term low as your stop if you're bullish.
Time Element and Price Levels
- The time element is static from 8:30 in the morning until 11 o'clock New York time.
- Use vertical lines at these specific times to anticipate optimal trade entry formation.
- Price should be between the 62% and 70.5% Fibonacci retracement levels.
Stop Loss and Entry Points
- Set your stop loss below the lowest candle or anchor point (e.g., at 64.30).
- Entry points can be at around the 62% tradesman level (e.g., at 64.49).
- Consider using a slightly more forgiving level like 60% if spread factors are involved.
New Section
The speaker explains why they focus on specific time frames during their trading strategy and how market conditions can influence bias determination.
Importance of Time Frames
- Focus on the time frame from 8:30 in the morning until 11 o'clock New York time.
- During this period, significant news is released, and market conditions are more favorable for trading.
Bias Determination
- Determine bias based on your daily chart analysis.
- If the previous day's high is likely to be taken out, it indicates a bullish bias.
- If the previous day's low is likely to be broken, it indicates a bearish bias.
Market Conditions and Focus
- Currently, employment numbers or lack of employment due to the pandemic are the main focus.
- The speaker emphasizes that specific data sets may vary in relevance over time.
- The key is to observe whether price takes out the previous day's high or low during the specified time frame.
New Section
The speaker discusses how price action can indicate optimal trade entries and highlights the importance of observing chart patterns.
Price Action Analysis
- Look for price movements during specific sessions (e.g., midnight in New York and London session).
- Analyze whether there has been buying or selling pressure above or below the previous day's high/low.
- Use this information to determine optimal trade entries.
Chart Patterns and Trade Entry Expectations
- The speaker demonstrates using Fibonacci retracement levels to identify entry points.
- Price should be between 62% and 70.5% retracement levels for optimal trade entries.
- Vertical lines can help anticipate when an optimal trade entry might form within a specific time frame.
Stop Loss and Entry Points
- Set stop loss below the lowest candle or anchor point (e.g., at 64.30).
- Entry points can be around the 62% tradesman level (e.g., at 64.49).
- Consider using a slightly more forgiving level like 60% if spread factors are involved.
New Section
This section discusses the rules for taking profits and scaling out in trading, using Fibonacci levels as a guide.
Taking Profits and Scaling Out
- When trading below a certain level, place your stop loss.
- Use Fibonacci levels (0.5 and -1) to determine areas for taking profits.
- Take first profit at the negative 0.5 level if it allows for at least 15 pips.
- Consider taking additional profits at the 0.65, 1.3, and 1.5 pipette levels suggested by Fibonacci.
- The next level up would be the rounded down value of the projected Fib level.
- Reduce risk by adjusting stop loss to the mid-point of the identified range after achieving first scaling with at least 15 pips profit.
- If a second scaling opportunity arises, ensure that you are above your entry point by at least 2 or 3 pips before letting it run.
New Section
This section emphasizes that Fibonacci levels are not always reached in trading setups and highlights the importance of understanding price action and logic behind setups.
Understanding Price Action and Logic
- Fibonacci is not always reached in trading setups; it provides general principles but does not guarantee specific targets.
- Rounding down to the nearest ten level can be used when projecting Fib levels.
- Focus on reading price action and understanding logic behind setups rather than relying solely on Fibonacci levels.
- The goal is not to be right or wrong on every trade but to have a high frequency of accuracy with a system that minimizes losses.
New Section
This section explains how to manage trades by taking partial profits, reducing risk, and allowing remaining positions to run.
Managing Trades
- Take partial profits at specific levels based on the projected Fib level or other criteria.
- Reduce risk by adjusting stop loss to the mid-point of the identified range after achieving first scaling with at least 15 pips profit.
- If a second scaling opportunity arises, ensure that you are above your entry point by at least 2 or 3 pips before letting it run.
- Understand that even with risk management measures in place, losses can still occur if the market moves against your position.
New Section
This section emphasizes the importance of using appropriate lot sizes and leverage to maximize scaling opportunities in trading.
Using Lot Sizes and Leverage
- Use lot sizes that allow for multiple partials and leave room for a remaining position to run.
- Not all positions will allow for multiple partials, so only take trades that align with this strategy.
- Paper trade or use a demo account to practice implementing this approach effectively.
New Section
This section concludes by highlighting the need to understand risk and accept that not all trades will be winners.
Understanding Risk
- Recognize that stops may not always work as intended, and losses can occur even with risk management measures in place.
- Accept that losses are part of trading but focus on having a high frequency of accuracy overall.
- The goal is to have a system that minimizes losses while providing frequent profitable setups.
New Section
The importance of rule-based trading and sticking to a set of criteria to reduce stress and anxiety.
Building Maturity as a Trader
- Rule-based trading builds maturity as a trader.
- Traders without rule-based ideas often experience more stress and anxiety due to constant guessing.
- Following specific criteria for trades helps protect against taking excessive risks.
New Section
The benefits of following rule-based trading over time.
Protecting Yourself from Excessive Risk
- By following rule-based trading over weeks, you can protect yourself from taking more risk than necessary.
- Consistency in following the rules leads to better results in the long run.
- It is important to understand that losses and mistakes are part of trading, and there is no magic recipe for always winning.
New Section
The importance of sticking with rule-based trading even when facing challenges.
Sticking with Rule-Based Trading
- Rule-based trading should be followed consistently, regardless of challenges or market conditions.
- By sticking with it, you can determine if the strategy has merit over time.
- Losses and mistakes are expected, but by following the rules, you will see positive results in your bottom line.
New Section
Analyzing a specific market scenario using levels and Fibonacci retracements.
Market Analysis Example
- Analyzing a market scenario where price action reaches a certain level (65 10) and reacts before retracing back into old order flow.
- Looking for an opportunity to catch a runner using Fibonacci retracements for additional levels (65 52).
- Setting targets based on two standard deviations above the current level.
New Section
The importance of consistency and continuity in trading.
Consistency and Continuity
- Long-term position trading is not the goal; instead, focus on consistency and continuity.
- Being able to anticipate market moves based on rule-based ideas and patterns.
- Avoid being surprised like many traders who react to sudden market movements.
New Section
Anticipating market moves through familiarity with patterns.
Anticipating Market Moves
- By familiarizing yourself with specific patterns and time of day, you can anticipate market moves.
- Traders who are surprised by market movements often lack anticipation skills.
- Developing the ability to see patterns repeat over time leads to better trading results.
New Section
Teaching yourself to see patterns in price action.
Activating Your Attention
- Similar to how buying a car makes you notice that car more often, teaching yourself to see specific patterns in price action activates your attention.
- By annotating charts with time of day and anticipated direction, you train your brain to recognize these patterns.
- Trusting what you have practiced over weeks and months allows you to identify live pattern formations without surprise.
New Section
Understanding the use of Fibonacci retracements in context.
Contextual Use of Fibonacci Retracements
- Price action works algorithmically based on elements of time and price, not magic Fibonacci levels.
- Using Fibonacci retracements as a way to frame the context for pattern recognition.
- Optimal Trade Entry (OTE) combines Fibonacci retracements with time elements and market structure analysis for trade entry points.
New Section
Scaling opportunities and setting targets in a trade scenario.
Scaling Opportunities
- Identifying two scaling opportunities within a trade scenario.
- Setting a target for exiting the market at a specific level.
- Using midpoint levels and Fibonacci retracements to add additional lines of importance.
New Section
Determining appropriate stop-loss levels based on market structure.
Trailing Stop-Loss
- Choosing an appropriate point of support or structure for placing a stop-loss.
- Avoiding setting a tight stop-loss that may choke the trade.
- Considering the current market structure and previous price action when determining stop-loss placement.
New Section
In this section, the speaker discusses the process of moving stop losses and taking partial profits in a trade.
Moving Stop Losses
- The speaker explains that when determining where to move your stop loss, you should consider the reactions and higher reactions in the market.
- It is advised not to place your stop loss at the nearest area where other traders have placed theirs.
- If there is a reaction and two higher reactions, it is recommended to move your stop loss to a level that allows for potential profit-taking.
- The speaker suggests collapsing the entire trade if it reaches a certain price level (e.g., 65.50) with a specific number of pips gained (e.g., 9 pips).
- By following these rules, you can aim for around 100 pips movement from the trade with multiple partial profit-taking opportunities.
New Section
In this section, the speaker discusses how the placement of stop losses and profit targets may vary based on market conditions.
Adjusting Stop Losses Based on Market Range
- The speaker explains that if the range allows for 100 pips but occurs before two standard deviations of the initial range used to create Fibonacci levels, adjustments need to be made.
- If the range is above 100 pips (e.g., 110 pips), it is suggested to take a partial profit at exactly 100 pips and bank some gains.
- Understanding market structure can help manage trades effectively by avoiding premature exits due to normal gyrations or sudden retracements.
New Section
In this section, the speaker emphasizes the importance of following specific criteria when moving stop losses and taking partial profits.
Following Specific Criteria
- The speaker advises revisiting and carefully listening to the video for specific criteria on when to move stop losses, what entry price to look for, where to place stop losses, and when to take partial profits.
- It is crucial not to choke a trade by placing stop losses too close based on support levels or other factors.
- Market structure can be used as a tool to manage trades effectively and avoid premature exits.
New Section
In this section, the speaker explains how market structure can help in managing trades and avoiding premature exits.
Utilizing Market Structure
- The speaker uses market structure to determine the placement of stop losses.
- Placing a stop loss at a low point based on market structure allows for normal gyrations without prematurely exiting the trade.
- By avoiding premature exits, traders can maximize their opportunities for profit-taking and reaching ultimate targets.
New Section
In this section, the speaker concludes by summarizing the rules discussed in the video and mentioning future videos.
Summary of Rules
- The speaker emphasizes that specific rules have been shared regarding moving stops, taking partial profits, and understanding the general principles of the trading pattern discussed.
- The video will serve as a reference for any future discussions related to these topics.
- Future videos will be shorter (around five minutes or less) with annotations on charts and brief explanations.
Timestamps are provided in seconds.