Función logarítmica Gráfica, Dominio y Rango | Ejemplo 1
How to Graph and Find the Domain and Range of Logarithmic Functions
Introduction to Logarithmic Functions
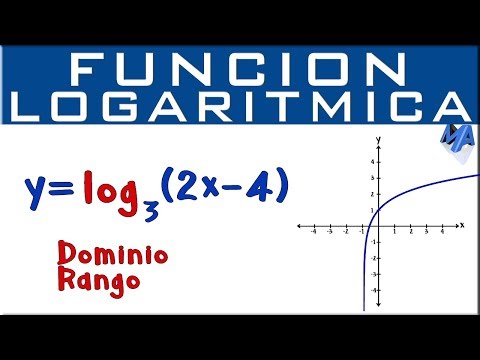
- The course focuses on graphing logarithmic functions, specifically y = a log_b(2x - 4) .
- The video is divided into two parts: first, an overview of how logarithmic functions are graphed, followed by practical application in finding domain and range.
Characteristics of Logarithmic Graphs
- Logarithmic graphs typically exhibit a curve that approaches but never touches the x-axis (asymptote).
- The base of the logarithm influences the shape of the graph; changing it alters the steepness but not the general form.
- Adjusting constants within the function shifts the graph horizontally or vertically without changing its overall shape.
Understanding Domain and Range
- The domain consists of all possible x-values. For example, with x geq -2 , it extends to infinity.
- The range includes all real numbers as logarithmic functions can increase indefinitely from negative infinity upwards.
Practical Examples
- Changing parameters affects domain while keeping range constant; for instance, altering a constant may shift where the function starts but does not limit its upward growth.
- Regardless of changes made to specific values in a logarithmic function, its range remains all real numbers due to its continuous nature.
Conclusion and Further Learning
- To solidify understanding, viewers are encouraged to practice with specific examples before moving on to more complex problems involving logarithms.
Understanding Logarithms and Their Properties
Finding Exponents in Logarithmic Functions
- The discussion begins with determining the exponent of 2 that results in 8, concluding that the exponent is 3 since 2^3 = 8.
- Next, it explores logarithm base 5 of 25, identifying the exponent as 2 because 5^2 = 25.
Using Calculators for Logarithmic Calculations
- It explains how to compute logarithms using a calculator by converting them to base 10: log_10(8)/log_10(2).
- Demonstrates this calculation yields a result of 3 when performed on a calculator.
Exploring Negative Values in Logarithms
- The conversation shifts to logarithm base 5 of -25, questioning what exponent would yield a negative result.
- It emphasizes that no positive number raised to any power can equal a negative number, leading to an error when attempting this calculation on a calculator.
Domain Restrictions for Logarithmic Functions
- Discusses the domain restrictions for logarithmic functions, stating that values must be greater than zero.
- A mathematical inequality is established: 2x - 4 > 0, which simplifies to x > 2.
Graphing and Analyzing Logarithmic Functions
- The graph's asymptote is identified at x = 2; thus, the graph approaches but does not touch this value.
- The domain is defined as all numbers greater than two, expressed in interval notation as (2, ∞).
Creating Value Tables for Graphing
- To visualize the function further, three values (3, 4, and 5) are chosen for x to create a table.
- Each selected x-value will be substituted into the logarithmic equation to find corresponding y-values.
Performing Calculations with Selected Values
- For x = 3: calculates y = log_3(6 - 4), resulting in log_10(2)/log_10(3).
Graphing Logarithmic Functions
Calculating Logarithmic Values
- The logarithm of 3 is calculated to be approximately 1.26, and for the number 5, substituting x with 5 gives a result of 2 times 5 = 10. Thus, 10 - 4 = 6, leading to the calculation of log(6) / log(3), which results in approximately 1.63.
Plotting Points on the Graph
- Key points are plotted: at x = 3, y is about 0.63; at x = 4, y is around 1.26; and at x = 5, y equals approximately 1.65. The graph starts from below and trends upwards.
Practice Exercise Introduction
- The instructor encourages viewers to practice by pausing the video and attempting an exercise related to finding domain and range as well as graphing functions.
Finding Domain and Range
- To find the domain, it’s noted that 4x + 1 > 0. Rearranging gives x > -1/4. This indicates that the domain starts from -1/4 extending towards infinity.
Understanding Asymptotes and Graph Behavior
- An asymptote is drawn at -1/4 since the graph approaches this value but does not cross it. The range includes all real numbers as the function continuously increases without bound.
Finalizing Graph Points
- For graphing purposes, points are calculated for values greater than -1/4:
- At x = 0: yields log base 5 of 1, resulting in y = 0.
- At x = 1: yields log base 5 of 5, resulting in y = 1.
- At x = 2: yields log base 5 of 9, resulting in approximately y = 1.36.
Conclusion and Further Learning Resources