ICT Forex Scout Sniper Basic Field Guide - Vol. 4
Episode 4: Basic Infantry in Trading
Overview of the Episode
- This episode focuses on basic infantry concepts in trading, specifically reviewing previous assignments and introducing new topics.
- The discussion includes a review of stalking in the kill zone and how it relates to market movements.
Key Concepts Introduced
- Directional Bias and Trade Framework: The episode revisits directional bias, emphasizing high probability trade setups and their strategic importance.
- Market Structure and Order Flow: A focus on understanding institutional orders, smart money fingerprints, and how consolidations create trading opportunities is highlighted.
- Institutional Sponsorship: The impact of institutional sponsorship on trading decisions is discussed, along with the concept of returning to the point of origin within optimal trade entry strategies.
Homework Assignment
- Viewers are assigned homework to track institutional price action as part of their learning process. This aims to deepen their understanding of market dynamics.
Analysis of Euro/USD Movement
Contextual Background
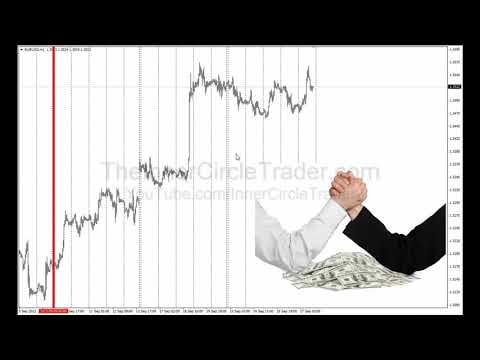
- The analysis begins with a daily chart review for the euro/USD currency pair, reflecting on previous discussions about rising yields affecting foreign currency markets since September 9th, 2013.
- Rising yields are linked to upward pressure on the euro/USD exchange rate, indicating a relationship between interest rates and currency value movements.
Price Movement Insights
- A significant movement of approximately 291 pips from the last recorded date is noted as an example of potential profit based on prior discussions about upward price movement expectations.
- An hourly chart is introduced to illustrate specific ICT kill zones relevant to this analysis, marking key points for traders' reference moving forward.
Understanding Market Dynamics
Interest Rates Impact
- The relationship between interest rates and currency values is emphasized; higher yields typically lead to bullish movements in foreign currencies while being bearish for the US dollar.
- A distinction is made regarding futures prices versus yield increases; falling futures prices indicate rising yields which can affect trader sentiment towards currencies like the euro/USD negatively or positively depending on context.
Risk-On/Risk-Off Sentiment
- A brief explanation is provided regarding risk-on/risk-off scenarios in trading; understanding these dynamics helps traders make informed decisions based on market conditions rather than solely relying on technical signals alone.
This structured approach provides clarity into each segment discussed during Episode 4 while linking back directly to timestamps for further exploration or review by viewers interested in deepening their knowledge around these trading concepts.
Understanding Market Dynamics and Trading Strategies
The Importance of Market Positioning
- When engaging in trades, it's crucial to recognize the prevailing market trends. Being a bull (optimistic) is often more advantageous than being a bear (pessimistic).
- Counteracting fundamental market drivers can lead to resistance against overall market movements; traders should be cautious not to overstretch their positions.
- Successful trading requires understanding that one should not fight against the prevailing market tide, as this can lead to exhaustion and losses.
Developing a Trading Plan
- Effective trading involves having a predetermined plan and method, rather than reacting impulsively based on short-term price movements.
- A comprehensive trading strategy includes knowing what actions to take, when to take them, and understanding the reasons behind these decisions.
Utilizing ICT Kill Zones for Timing Trades
- The discussion transitions into using ICT kill zones to identify optimal buying opportunities during upward market movements.
- The analysis focuses on specific timeframes: the London session (red dashed lines) and New York session (green lines), which are critical for timing trades effectively.
Analyzing Price Movements Within Sessions
- Traders should look for pullbacks within defined time windows each day, focusing on ranges established during previous sessions.
- Identifying retracement opportunities within these ranges allows traders to position themselves advantageously as markets move higher.
Practical Application of Trading Concepts
- Observations from specific dates highlight how price movements align with identified highs and lows within sessions, providing actionable insights for traders.
- Clarification is provided regarding indicators used for tracking Asian range barriers while analyzing New York session dynamics.
Key Takeaways from Session Analysis
- On September 10th, recognizing swing highs and lows within both London and New York sessions can inform better trading decisions.
- Highlighting optimal trade entry areas helps traders understand where significant price action occurs, particularly around key Fibonacci levels like 70.5%.
Understanding Trading Platforms and Time Zones
Choosing a Trading Platform
- The speaker recommends using MT4 as a generic trading platform due to its accessibility, cost-effectiveness, and universal application.
- Acknowledges that there are variances in the time frames used for trading compared to personal practices, emphasizing the importance of clarity in communication.
Addressing Common Confusions
- The speaker reflects on recurring questions from traders regarding time windows and global positioning, admitting it can be confusing.
- To simplify this confusion, a generic time window for London and New York sessions is provided to help traders find opportunities.
Trading Strategies During Key Sessions
- Emphasizes that tools will not guarantee every trade; instead, they provide an edge that requires individual effort to utilize effectively.
- Discusses observing market behavior during specific sessions (London and New York), highlighting significant price movements and retracement strategies.
Analyzing Market Movements
- Describes how to identify lows and highs within trading sessions, suggesting traders look for retracements back into established ranges.
- Advises on using swing lows and highs for potential entry points during the London session.
Timing Considerations in Trading
- Notes the overlap between London and New York sessions may lead to busy market conditions but also mentions potential pauses around 5:00 AM NY time or 10:00 GMT.
- Suggests treating these pauses like lunch breaks where consolidation occurs before trends resume.
Practical Trade Examples
- Provides an example of taking trades based on identified swing lows during both London and New York sessions with documented results.
- Highlights the importance of real results over demo trades when discussing successful strategies.
Summary of Price Movements
- Recaps recent price movements from previous days' lows up to highs before entering key trading sessions.
Analysis of Price Movements and Trading Strategies
Understanding Price Swings and Levels
- The discussion begins with an analysis of price swings, highlighting the significance of high saturation levels and their role as precursors to market movements.
- A notable weekend gap is mentioned, which indicates that all stops were taken out, demonstrating a classic trading strategy where clean highs attract stop-loss orders.
- Introduction of the "hidden optimal trade entry" technique, emphasizing the importance of support and resistance levels in identifying potential trading opportunities.
Support and Resistance Dynamics
- The speaker asserts that certain levels can be recognized as discernible resistance, which may later act as support if breached.
- The concept of gaps in trading is introduced; these gaps represent ranges where no trading occurs but are still significant for future price movements.
- It’s explained that gaps do not always need to fill immediately or at all, especially in long-term trends where institutional buying influences prices.
Utilizing Fibonacci Retracement
- The use of Fibonacci retracement levels is discussed as a method to identify potential reversal points within established ranges.
- Clarification on different types of gaps: common gaps tend to fill quickly while breakaway gaps may remain unfilled for extended periods due to strong market trends.
Trading Opportunities from Market Patterns
- Emphasis on recognizing short-term trading opportunities based on support/resistance dynamics and Fibonacci levels, suggesting a 40-pip potential gain from understanding these concepts.
- Discussion about market uncertainty when dealing with large gaps; traders should be cautious about entering positions without clear signals.
Case Study: FOMC Release Impact
- An example involving the FOMC release illustrates how prior price action can inform potential buying opportunities during consolidation phases.
Market Dynamics and Trading Strategies
Understanding Market Movements
- The market showed strong upward movement without retracing to the support level, indicating bullish sentiment during key trading sessions like the London and New York opens.
- Price consolidation occurred as traders anticipated a pullback after significant rallies, highlighting the tendency of average traders to enter positions expecting similar price movements.
- Post-economic report behavior often leads to market rebalancing, where prices consolidate before making further moves, emphasizing the importance of liquidity in trading decisions.
Analyzing Price Action
- A wait-and-see approach is recommended when aggressive price movements occur; small ranges typically follow large daily ranges, signaling potential trading opportunities.
- The discussion highlights that a substantial daily range (212 pips) can lead to smaller subsequent ranges, suggesting caution and discernment in identifying trade setups.
Key Trading Concepts
- Following FOMC releases, minor retracements can indicate shifts in market structure towards bullish trends; recognizing these patterns is crucial for effective trading strategies.
- Traders should focus on specific time windows (kill zones), which provide optimal conditions for entering trades based on historical price action within those periods.
Trade Execution Insights
- Identifying swing levels during kill zones helps traders determine entry points; understanding previous highs and lows aids in making informed decisions about potential trades.
- Candlestick patterns resembling railroad tracks may signal pressure absorption; this technical analysis tool assists traders in predicting future price movements based on past behavior.
Strategic Planning for Traders
- Recognizing profit-taking times (e.g., 1500 GMT candle) allows traders to anticipate market reactions and adjust their strategies accordingly for better outcomes.
- Emphasizing a focused approach rather than attempting to capture every market move can enhance trading effectiveness; having a clear plan is essential for consistent success.
Building Confidence as a Trader
- Many traders struggle with directional bias; understanding when not to act is just as important as knowing when to engage with the market effectively.
- Developing a repeatable trading plan tailored for various market conditions fosters confidence among new traders while encouraging patience and strategic engagement.
Understanding Trading Dynamics
Importance of Timing in Trading
- The significance of knowing when to take a trade is emphasized, as there are more opportunities to lose money than to gain it. Understanding the timing can lead to better trading decisions.
- The odds of losing money are greater compared to the small windows of profitable trade setups available in the market. This highlights the need for strategic engagement rather than impulsive trading.
Framework for Analysis
- A framework is presented for traders, suggesting that every trader will interpret charts differently based on their perspectives and expectations. This framework serves as a foundation for building trading strategies.
- The content aims to provide clarity on when to engage in trades and what actions should be taken during those times, reducing ambiguity in decision-making processes.
Learning Through Observation
- Emphasis is placed on understanding market patterns through observation rather than immediate application after watching instructional videos; this process activates one's reticular activating system, enhancing pattern recognition over time.
- Continuous learning from personal experiences and journaling about trades can lead to self-discovery and improved trading skills, not just knowledge about market mechanics.
Anticipating Market Behavior
- Traders are advised to observe price action and behavior without actively engaging in trades initially; this observational phase helps build a foundational understanding of market movements within specific time frames.
- Identifying "cherries" or optimal trading opportunities requires patience and discernment rather than acting on impulse due to external factors like time constraints or market hours.
Kill Zones and Market Dynamics
- "Kill zones" refer to specific times when significant market activity occurs; however, they must be understood within a broader context of market dynamics rather than seen as standalone indicators for making trades.
- Historical examples illustrate how fundamental factors such as interest rates influence currency movements across various markets, reinforcing the importance of understanding these dynamics before entering trades.
Market Movement Catalysts
- A discussion arises regarding what drives market movements: retail traders versus large institutional players; it’s noted that institutions have a more substantial impact due to their volume and presence in asset classes.
Understanding Market Dynamics and Smart Money Trading
The Impact of Large Players in the Market
- The presence of large institutional traders is likened to an elephant entering a children's pool, causing significant market displacement that cannot be overlooked.
- A sudden price movement, such as a 500 pip rally, can often be traced back to these larger players rather than retail traders.
- Retail traders alone do not have the capacity to move the market significantly; their influence is minimal compared to institutional "smart money."
- Long-term trends are primarily driven by institutional investors and trading banks, which maintain momentum until fundamental or technical changes occur.
- Traders should align their strategies with smart money actions to effectively participate in market movements.
Trading Strategies Based on Smart Money Insights
- This section will focus on specific trading strategies that leverage insights from smart money actions and candlestick patterns.
- The concepts discussed are applicable across various asset classes including commodities, stocks, and debt instruments, not just forex.
- Understanding institutional ordering and order flow through price action does not rely on traditional indicators; it offers a forward-looking approach.
- High probability trades are characterized by alignment with higher time frame charts and current market conditions (risk-on/risk-off).
- Successful trading requires synchronization with dominant market trends established by larger players rather than relying solely on indicators.
Identifying High Probability Trades
- An example using the EUR/USD pair illustrates how significant price movements originate from large players rather than retail activity.
- Recognizing clues left in charts can help traders understand when they are aligned with smart money movements for high probability setups.
- A trade qualifies as high probability when it moves in sync with established trends set by institutional traders.
- Avoiding contrarian positions against strong smart money influences is crucial for successful trading outcomes.
- Price action analysis provides insight into what large institutions are doing, making it essential for effective technical analysis.
Directional Bias Concepts
Understanding Market Dynamics and Trading Strategies
The Importance of Higher-Level Charts
- Understanding higher-level charts is crucial for recognizing support/resistance, price action, and market tendencies. Markets often move in one direction until a significant event causes a shift.
- Analyzing the rally from July highlights the importance of identifying price ranges to understand market movements effectively.
Significant Price Movements
- A notable movement from 127.57 to 134.50 represents approximately 700 pips, indicating substantial price action that traders should consider.
- Previous lows in currency pairs like the cable (GBP/USD) can be anticipated using ICT concepts, which help predict market behavior based on established patterns.
Institutional Influence on Market Trends
- Large institutional traders significantly influence market movements; understanding their actions can provide insights into potential trading opportunities.
- While short-term trading is valid, this series emphasizes aligning trades with larger time frame trends for better probability outcomes.
Trading Strategies: Buying Dips and Selling Rallies
- Traders should focus on buying dips during upward trends and selling rallies during downward trends to align with macro perspectives.
- This approach contrasts with typical retail trader behavior, who often react rather than anticipate market moves.
Anticipating Economic Events
- Successful traders consult economic calendars to anticipate volatility injections from reports that can confirm or alter existing market moves.
- Recognizing key dates for high-probability volatility helps seasoned professionals position themselves advantageously compared to less informed traders.
Moving Beyond Basic Trading Knowledge
- Aspiring traders should aim to elevate their skills beyond basic strategies offered by many online services that lack depth and effectiveness.
- The upcoming content promises impactful insights if applied correctly; simplicity in procedures is emphasized for effective learning.
Focused Learning Approach
- Avoid overwhelming yourself with excessive information; concentrate on essential candlestick patterns relevant to your trading strategy.
- Prior foundational knowledge about general market insights will aid in digesting intraday price movements effectively without falling into information overload.
Language Learning Analogy
Understanding Market Dynamics and Trading Strategies
The Importance of Learning in Trading
- The initial release of information often goes over people's heads as they seek quick results rather than a comprehensive understanding of the market.
- A macro perspective is essential; without it, traders may miss critical insights from previous teachings that are foundational to grasping upcoming discussions.
Developing a Trading Mindset
- Successful trading isn't about predicting specific candle patterns but understanding broader market parameters and their implications.
- Skills learned will help eliminate emotional responses in trading, which can hinder decision-making.
Tools and Techniques for Effective Trading
- The tools shared are not overly complex; many are simple yet effective strategies that can be easily understood with practice.
- Gaining "ICT vision" allows traders to see price action through a professional lens, enhancing their ability to identify opportunities.
Directional Bias Concepts
- Introduction to directional bias concepts aims to prepare traders for what they should look for each week in the market.
- Utilizing moving averages helps maintain momentum and prevents unnecessary attempts at picking tops or bottoms in the market.
Chart Analysis Strategy
- Focus on one strong setup per week using daily charts as higher time frames while acknowledging monthly and weekly support/resistance levels.
- New traders are advised to start with demo accounts, studying intraday movements after trades to understand price action better.
Implementing Moving Averages
- Use MT4 platform indicators: apply an 18-period moving average alongside a 9-period exponential moving average for clearer insights into institutional flow.
- While no trade guarantees success, this method aims to highlight two to four significant setups monthly, equating to one solid opportunity weekly.
Achieving Success Through Consistency
Trading Psychology and Strategy Insights
The Addiction to Trading Success
- The thrill of making money in trading can lead to an addiction, where traders seek the "fix" of successful trades repeatedly.
Overcoming Psychological Barriers
- New traders often struggle with accepting losses; they tend to focus on winners while blocking out losers, which is a critical mindset hurdle to overcome.
Strategic Approaches to Trading
- Successful trading requires a balance between acting slowly when trying to make money and reacting quickly when protecting capital. This dual approach is essential for preserving equity.
Framework for Trade Decisions
- Establishing a framework using moving averages (9-period vs. 18-period) helps identify market trends:
- A bearish framework occurs when the 9-period average is below the 18-period average.
- Conversely, a bullish outlook arises when the 9-period average is above the 18-period average.
High Probability Trades
- Identifying high probability trades involves recognizing market conditions without feeling pressured to pick tops or bottoms. Tools are available for macro perspective analysis but immediate application in dynamic trading scenarios is emphasized.
Limiting Overtrading
- New traders should aim for fewer trades per week (12-14 maximum), focusing on quality setups rather than quantity, which helps develop patience and reduces excessive trading behavior.
Professional Trading Mindset
- Professional traders do not spend excessive time in front of screens; instead, they maintain a balanced lifestyle away from charts, contrasting with those who may become addicted to constant monitoring.
Risk Management and Adjustment Strategies
Understanding Market Dynamics and Trading Strategies
The Importance of Risk Management
- Emphasizes the significance of understanding equity decline and risk management in trading. Professional traders consistently assess their risks, potential profits, and strategies to minimize risk.
Analyzing Market Signals
- Discusses the focus on buy and sell signals rather than solely relying on chart analysis. Recognizing market predispositions is crucial, as traders often face temptations to over-leverage their accounts.
Utilizing Moving Averages for Trade Decisions
- Introduces the concept of using moving averages (9-period vs. 18-period) to determine market trends. When the 9-period average is below the 18-period, it indicates a selling mindset.
- Highlights that moving averages serve as dynamic support/resistance levels, providing insights into price reactions without relying on trend lines.
Understanding Market Structure
- Explains how recognizing market structure can enhance trading decisions. The speaker aims to create a vocabulary for discussing these concepts effectively.
- Reinforces that when the 9-period moving average is above the 18-period, traders should look for buying opportunities; conversely, they should sell when it's below.
Advanced Trading Techniques
- Mentions that while basic strategies are effective, further amplification of directional bias understanding is necessary for more advanced trading success.
- Describes applying market structure and order flow analysis after removing moving averages to identify bullish or bearish momentum based on swing highs/lows.
Identifying Swing Highs and Lows
- Defines a swing high using fractals in MT4 (MetaTrader 4), explaining how identifying these patterns can signal potential market movements.
Understanding Market Structure and Trading Opportunities
Analyzing Price Movements
- The price remains above the recent swing high, indicating a bullish trend as long as it does not break the previous swing low.
- A retracement occurs within a defined range, breaking the previous swing high, which is crucial for identifying potential buying opportunities on a daily chart.
- The use of Fibonacci levels reveals insights into market behavior; despite minor violations, price quickly returns to an upward trajectory.
Identifying Trading Strategies
- Discusses how to anticipate buying opportunities by analyzing past price movements and ranges effectively.
- Emphasizes that there are significant profit opportunities (e.g., 130 pips in one week), advocating for realistic trading goals rather than unrealistic expectations like 2,000 pips monthly.
Money Management Insights
- Questions the credibility of traders claiming high pip counts without substantial wealth, suggesting that effective money management is more critical than sheer pip accumulation.
- Highlights that many traders fail to manage their equity properly, leading to poor financial outcomes despite reported successes.
Realistic Trading Goals
- Advocates for focusing on achievable targets such as 50 pips per week instead of overwhelming monthly goals; this approach can be consistently replicated.
- Encourages maintaining consistent trading strategies without deviation while managing risk effectively to avoid unnecessary losses.
Risk Management Techniques
- Critiques reliance on candlestick patterns due to their deceptive nature; emphasizes understanding price action through broader ranges instead.
- Suggests viewing price swings from lows to highs during ideal time frames can reveal tradable ranges even amidst bearish trends.
Stop Loss Placement and Market Engagement
- Discusses how proper stop loss placement should be based on logical analysis rather than fear of being stopped out prematurely.
Market Structure and Trading Strategies
Understanding Market Consolidation and Momentum Shifts
- The market experiences a consolidation phase before breaking out, indicating a shift in order flow to bearish when it trades lower, particularly after breaking a swing low.
- Critique of the fractal indicator: It requires three bars to form a swing high, but significant candles can negate this formation despite being valid swing highs.
- Acknowledgment that even if a candle does not meet fractal criteria, it can still represent a swing high; bullish momentum resumes once the candle breaks above.
Analyzing Moving Averages and Price Action
- The importance of moving averages: When the 9-period average is above the 18-period average on daily charts, it indicates bullish market structure.
- Traders should look for price support within ranges on shorter time frames (4-hour or 1-hour charts), waiting for specific setups before entering trades.
Candlestick Patterns and Their Relevance
- Emphasis on simplicity in candlestick patterns: Preference for basic patterns like dojis and hammers over complex formations; skepticism towards their overall utility.
- Observations about candle bodies at key levels: Noting how opening and closing prices align with significant levels can provide insights into market behavior.
Retracement Levels and Fibonacci Analysis
- Discussion of retracement levels within trading ranges: Identifying old resistance turned support does not guarantee price will return to those levels.
- Utilizing Fibonacci retracement from significant lows to highs helps anticipate potential price action during intraday movements.
Opportunities in Bullish Framework
- Recognition of higher swing lows as an indication of ongoing bullish momentum; traders should remain alert for opportunities to go long.
Market Analysis and Order Flow Insights
Understanding Price Movements and Market Structure
- The fractal low indicates a breakdown in price, confirming expectations for lower prices as both moving averages (9 below 18) align with this bearish framework.
- Focus on order flows trending lower; identifying ranges is crucial. Traders should look to sell into rallies after observing swing lows breaking down.
- Discusses the significance of retracement levels (62%) in relation to institutional order flow, highlighting areas where market structure shifts can be identified on lower timeframes.
Analyzing Candle Patterns and Market Sentiment
- Observations on market behavior: a thin wick suggests rapid movement away from a high, indicating bearish sentiment as the market closes near its low.
- The importance of recognizing successive lower swing lows and highs is emphasized, providing opportunities for traders to identify potential selling points.
Liquidity and Stop-Loss Dynamics
- Swing highs often represent liquidity zones where traders place stop-loss orders; markets may rally just above these levels before dropping again.
- Despite fluctuations, the overall range remains intact. Sellers should remain vigilant for opportunities when breaking below established lows.
Recognizing Dead Opportunity Areas
- Acknowledges missed trading opportunities that yield no profit, labeling them as "dead opportunity areas" where no reasonable equity increase occurs.
- A shift back to bullish sentiment occurs once certain swing highs are penetrated; however, caution is advised within an overall bearish framework.
Trading Strategies Based on Market Flow
- Emphasizes patience in waiting for clear signals before entering trades; understanding swing lows helps define entry points in a bearish context.
- Highlights the necessity of selling into rallies while being aware of short-term bullish movements within a broader bearish trend.
Final Thoughts on Trading Opportunities
- Identifies key resistance levels where price action stalls before reversing direction; traders should monitor these closely for potential selling opportunities.
Understanding Market Dynamics Through Chart Analysis
The Importance of Timeframes in Trading
- Utilizing different timeframes, such as the daily and 4-hour charts, can enhance understanding of market movements and trading opportunities.
- Recognizing areas of consolidation is crucial; these zones often indicate where smart money is accumulating positions.
Identifying Institutional Activity
- Price movements that result in significant pips (e.g., 465 pips over four days) suggest institutional involvement rather than retail trader activity.
- Retail traders often chase trends, leading to losses when they sell breakouts or patterns without understanding underlying market dynamics.
Recognizing Accumulation and Distribution Phases
- Institutional sponsorship is vital for successful trades; it indicates that large players are building positions during consolidations.
- A strong price movement followed by consolidation may signal a potential continuation of the trend, suggesting further upward movement.
Analyzing Candle Structures for Insights
- The body of candles provides valuable information about market sentiment; observing how prices react within these structures can reveal institutional intentions.
- Areas where price fails to break previous lows during consolidations may indicate significant buying interest from institutions.
Understanding Stop Runs and Market Repricing
- A stop run occurs when prices dip below key support levels to clear out existing orders before reversing direction, indicating potential bullish moves ahead.
- Institutions may allow prices to decline temporarily to accumulate more positions at favorable levels before supporting the market again.
Shifts in Market Structure
- Thinking like an institution rather than a retail trader helps understand their vested interests in maintaining market stability and upward momentum.
Understanding Institutional Order Blocks in Trading
Defining Institutional Order Blocks
- The speaker discusses the concept of institutional order blocks, emphasizing their significance in trading strategies. These are areas where price consolidates before a strong market movement occurs.
- A key observation is that significant price movements (hundreds of pips) indicate institutional involvement, as retail traders typically cannot influence the market to this extent.
Market Structure and Smart Money
- The discussion highlights how market structure can be analyzed on lower timeframes, particularly focusing on bullish price expectations when breaking above certain levels.
- It is emphasized that "smart money" accumulates positions during down moves rather than chasing prices upwards, which is crucial for effective trading strategies.
Analyzing Price Movements
- The speaker notes the importance of understanding higher timeframe trends while observing intraday movements. This dual perspective aids in identifying potential trading opportunities.
- Two large institutional order blocks are identified, indicating areas where significant buying or selling has occurred, which can inform future trades.
Retracement Opportunities and Market Dynamics
- As prices rally from established lows, consolidation phases present opportunities for traders to enter positions based on previous order block formations.
- The analysis includes recognizing retracement points within these order blocks as potential buy signals when prices return to these levels.
Optimal Trade Entry Patterns
- The speaker introduces the ICT optimal trade entry pattern, explaining its mechanics and relevance in identifying favorable trade setups.
Market Dynamics and Trading Strategies
Understanding Market Movements
- The market often experiences quick downward movements, which can mislead participants into thinking the market will continue to decline. This is particularly notable when the overall trend is bullish.
- Traders who focus on lower timeframes (1, 5, 15 minutes) may find it challenging to maintain a consistent daily bias due to these fluctuations. A broader perspective using daily and four-hour charts can help stabilize trading decisions.
Long-Term Perspective in Trading
- Maintaining a long-term view helps traders avoid being swayed by daily price swings. Recognizing that significant moves often occur over several days can lead to better decision-making.
- After substantial upward movements, retracements are common; understanding this pattern allows traders to anticipate potential entry points more effectively.
Analyzing Price Action
- When analyzing smaller consolidations within larger trends, it's crucial to identify key support levels established on higher timeframes. This aids in making informed trading decisions based on historical price behavior.
- Institutional trading patterns can be mimicked by recognizing areas of potential support and retracement levels, allowing for strategic entries during price corrections.
Utilizing Technical Tools
- Employing tools like Fibonacci retracement levels can provide insights into where prices might reverse or consolidate after significant moves. For instance, observing how prices react at specific Fibonacci levels can indicate future direction.
- A break in the four-hour chart's structure signals potential bullish momentum; traders should prepare for dynamic price surges following such breaks.
Risk Management Strategies
- Identifying points of origin for price movements is essential for effective risk management. Traders should look for previous swing highs or lows as reference points for setting stop-loss orders.
- By understanding the dynamics of order blocks and their impact on pricing, traders can reduce risk significantly while maintaining favorable reward-to-risk ratios.
Observing Institutional Behavior
Understanding Market Dynamics and Trading Strategies
The Concept of Double Bottom Patterns
- A double bottom pattern indicates that once the price drops, it typically does not fall much lower due to institutional traders entering the market, which stabilizes the price.
- Buying opportunities arise when prices dip back into specific areas, allowing traders to accumulate more positions before a rally.
Analyzing Price Movements
- After a retracement to the point of origin, traders can identify blocks of trades for long positions, indicating potential upward movement towards previous highs.
- Traders should assess risk-reward ratios; for instance, risking 50 pips could yield a reward of 240 pips, presenting an attractive opportunity.
Time Frame Considerations in Trading
- Patience is crucial; waiting for setups allows traders to manage their time effectively and avoid impulsive decisions based on market fluctuations.
- Transitioning from higher time frames (like four-hour charts) to shorter ones (like 15-minute charts) helps refine entry points and strategies.
Identifying Key Levels and Patterns
- Utilizing Fibonacci levels or pivot points can enhance predictions about where prices may head next; round numbers also serve as significant psychological barriers.
- Observing three-bar patterns at swing highs provides insights into potential reversals or continuations in price movements.
Fine-Tuning Entry Points
- Extending horizontal lines across identified price levels aids in determining optimal entry points while minimizing stop-loss distances.
- Recognizing candles that indicate points of origin for rallies assists in timing entries accurately within intraday trading contexts.
Managing Risk with Stop-Loss Orders
- Setting precise stop-loss orders below key reference points allows traders to limit risks effectively while maintaining favorable entry conditions.
Understanding Price Movements and Trading Strategies
Analyzing Price Rallies and Support Levels
- The discussion begins with observing a price rally, emphasizing the excitement of traders when prices move as anticipated.
- A key support level is identified on a daily chart, highlighting a bullish formation that suggests potential areas for institutional trading.
- The concept of order blocks is introduced, indicating where institutional trading may occur based on previous candle formations before price movements.
- The first bearish candle prior to an upward movement is noted, suggesting it could serve as a significant support and resistance level.
- A retracement opportunity is discussed, showing how price returns to an institutional order block before rallying again.
Identifying Key Support Areas
- As the market loses certain levels, new areas for expected support are highlighted; this helps in predicting future price movements.
- A horizontal line drawn across the chart indicates reasonable expectations for price bounces based on historical data.
- Utilizing Fibonacci tools reveals critical retracement levels that align with previous points of origin in price action.
- Understanding timeframes and kill zones enhances predictions about when significant market moves might occur.
Applying Tools for Trade Entry
- Transitioning to shorter time frames allows traders to apply learned tools effectively for directional bias in trades.
- A focus on 15-minute charts illustrates how intraday actions can be analyzed using established ranges from previous days' trading sessions.
- Specific times like the London open (9 GMT) are marked as opportunities for long positions based on market momentum indicators such as moving averages.
Establishing Bullish Scenarios
- The framework of bullish scenarios is reinforced by identifying periods where the 9-period exponential moving average exceeds the 18-period average, signaling upward momentum.
- Clear points of conviction in price movement are emphasized; these moments indicate strong buying opportunities within established ranges.
Market Structure Analysis
- Observations about market structure reveal patterns such as lower lows and higher lows that suggest bullish trends without additional indicators needed.
Understanding Market Structure and Trading Strategies
Analyzing Bullish and Bearish Candles
- The first bullish candle indicates a potential upward movement, with the range defined for analysis. Key timestamps include 9:00 GMT (bullish candle) and 9:30 GMT (London open).
- A shift in market structure is identified when the price returns to a previous range, marking an entry point for buying with a risk of 10 pips below the reference level.
- Example trade setup at the 70.5 level (130.107), with a stop loss set at approximately 130.86, indicating a manageable risk-reward ratio within expected trading ranges.
Utilizing Fibonacci Retracement Levels
- Observations on price movements show that after breaking swing highs, prices often retrace back to their origin points; this is where Fibonacci levels are applied for potential entries.
- The importance of timing is emphasized by noting specific candles forming before significant market events, such as those occurring at 6:30 GMT prior to London session openings.
Entry Points Based on Asian Range High
- Buyers should consider entering below the Asian range high as an optimal strategy; this aligns with previous discussions about filtering trades based on session highs and lows.
- The New York session also presents opportunities where bearish candles precede upward movements, reinforcing the concept of returning to order blocks.
Identifying Order Blocks and Trade Opportunities
- Market structure shifts can be traced back to specific bearish candles that serve as order blocks; these areas indicate where institutional buying may occur.
- Recognizing session highs and lows helps traders identify key points of origin for price movements, enhancing decision-making during trades.
Evaluating Daily Ranges and Trade Management
- Understanding daily ranges assists in identifying potential retracements in uptrends; traders should look for dips as buying opportunities.
- A practical example illustrates how daily movement from opening prices can yield significant profit margins when managed correctly—highlighting effective risk management strategies.
Market Analysis and Trading Strategies
Identifying Trading Opportunities
- The discussion begins with identifying potential trading opportunities, specifically targeting gains of 20 to 30 pips from market movements.
- A double bottom pattern is highlighted, indicating a return to an original order block before a rally, emphasizing the focus on buying opportunities.
- An example of a losing trade is presented to illustrate that not all trades will be successful; transparency in trading outcomes is essential for realistic expectations.
- The analysis includes observing price movements below previous session lows, which can indicate stop runs before upward trends resume.
Market Structure and Timing
- The importance of understanding institutional levels and points of origin in price movement is discussed, as they provide context for future price actions.
- A specific intraday opportunity is noted where a bearish candle signals a return to an order block, allowing traders to capitalize on short-term moves (approximately 40 pips).
- Emphasis is placed on the ideal days for trading: Monday through Wednesday are identified as optimal times for entering long positions based on weekly lows.
Weekly Trading Patterns
- Clarity in identifying weekly lows is provided; Monday's low serves as a significant point for potential buying opportunities throughout the week.
- Observations about market tone shifts are made; despite deeper retracements, there remain viable buying opportunities early in the week.
- The concept of "one shot one kill" scenarios highlights the strategy of making fewer trades but aiming for substantial pip gains when conditions align favorably.
Transitioning Market Dynamics
- As the week progresses into Thursday and beyond, traders should adjust their strategies as market dynamics shift towards lower prices.
- A reversal strategy is suggested where traders can apply similar principles used for buying when analyzing selling opportunities later in the week.
Optimal Trade Entry Techniques
- Discussion transitions to support and resistance concepts critical for determining high-probability trade entries using ICT optimal trade entry patterns.
- Key indicators such as breaking previous highs signal bullish sentiment among smart money traders who control market directionality.
Understanding Market Structure and Entry Points
Identifying Key Price Levels
- The focus is on waiting for the price to return to its point of origin, specifically the first bearish candle, indicating a break in market structure.
- Traders should train their eyes to identify significant price swings that are crucial for setting Fibonacci retracement levels.
- The 17.5 level is highlighted as a "sweet spot" for entry points, with considerations for pip spread and Fibonacci levels based on different time frames.
- Emphasis is placed on maintaining stop-loss orders within acceptable risk parameters while executing trades based on identified patterns.