REGLA EMPÍRICA | DISTRIBUCIÓN NORMAL: TEORÍA Y EJERCICIO 1
Understanding the Empirical Rule of Normal Distribution
Overview of the Empirical Rule
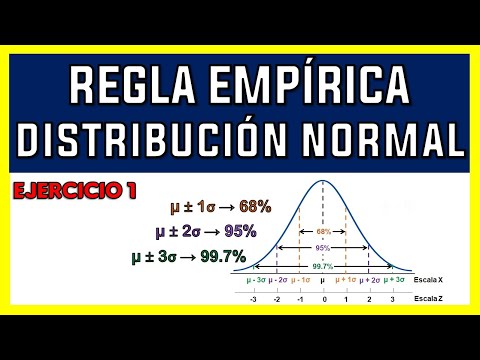
- The empirical rule describes three key areas under the normal distribution curve, with approximately 68% of data falling within one standard deviation from the mean. This is represented as "mean ± 1σ" where σ is the standard deviation.
Areas Under the Curve
- About 68% of values lie within one standard deviation (±1σ) from the mean, which is at the center of the normal curve. Negative and positive signs indicate deviations to the left and right, respectively.
- Approximately 95% of values are found within two standard deviations (±2σ) from the mean, indicating a broader range than just one standard deviation. This area extends two units to both sides of the mean.
- Nearly all (99.7%) values fall within three standard deviations (±3σ) from the mean, representing almost total coverage under the curve. Some authors may refer to this as practically all area under it.
Application of Standard Deviations
- For an area covering 68%, use "mean ± 1σ"; for 95%, apply "mean ± 2σ"; and for nearly all data, utilize "mean ± 3σ". These transformations adjust measurements into standardized z-scores: e.g., ±1σ corresponds to z = ±1.
Z-Scores in Normal Distribution
- The center of a z-distribution is zero, indicating no deviation from the mean; positive values represent deviations above while negative values indicate below average scores on either side of zero.
Example Calculation Using Juice Container Fill Levels
Mean and Standard Deviation Context
- In a population of juice containers with a mean fill level of 356 ml and a standard deviation of 0.60 ml, we will analyze how these figures relate to our understanding of normal distribution using empirical rules for different areas under consideration.
Calculating One Standard Deviation Range
- For one standard deviation (68%), calculate:
- Lower limit: 356 - (1 times 0.60) = 355.4
- Upper limit: 356 + (1 times 0.60) = 356.6
- Interpretation: Approximately 68% will be between 355.4 ml and 356.6 ml in fill levels.
Calculating Two Standard Deviations Range
- For two standard deviations (95%), calculate:
- Lower limit: 356 - (2 times 0.60) = 354.8
- Upper limit: 356 + (2 times 0.60) = 357.2
- Interpretation: About 95% will be between 354.8 ml and 357.2 ml.
Calculating Three Standard Deviations Range
- For three standard deviations (99.7%), calculate:
- Lower limit: 356 - (3 times 0.60) = 354.2
- Upper limit: 356 + (3 times 0.60) = 357.8
- Interpretation: Approximately 99% will be between 354.2 ml and 357 .8 ml, suggesting that nearly all containers fall within this range.
Conclusion
The video concludes by encouraging viewers to engage with content through likes, shares, comments, and subscriptions while promising more informative videos in future sessions.