Lecture 6 - LV Diastolic Function
New Section
This section provides an introduction to the topic of diastolic function and filling pressures in echocardiography. It explains the importance of understanding diastolic function and outlines the four phases of diastole.
Definition and Phases of Diastolic Function
- Diastolic function refers to the filling function of the heart and is an integral part of a complete echocardiographic study.
- Diastolic function is divided into four phases, which are dependent on the filling and pressure difference between the left ventricle (LV) and left atrium (LA).
- Isovolumic relaxation time (IVRT): No actual filling occurs in the LV during this phase.
- Rapid filling phase: Occurs when the mitral valve opens and LV pressure decreases below LA pressure.
- Diastasis phase: Characterized by minimal flow between LA and LV.
- Atrial contraction phase: Involves ejection of remaining blood from LA into LV.
Assessment of Diastolic Function
- Pulmonary vein flow pattern can provide information about diastolic function. During atrial relaxation, most filling occurs, resulting in an S wave higher than an E wave.
- LV relaxation can be assessed by measuring annular velocity using tissue Doppler imaging. A lower e' velocity indicates impaired relaxation.
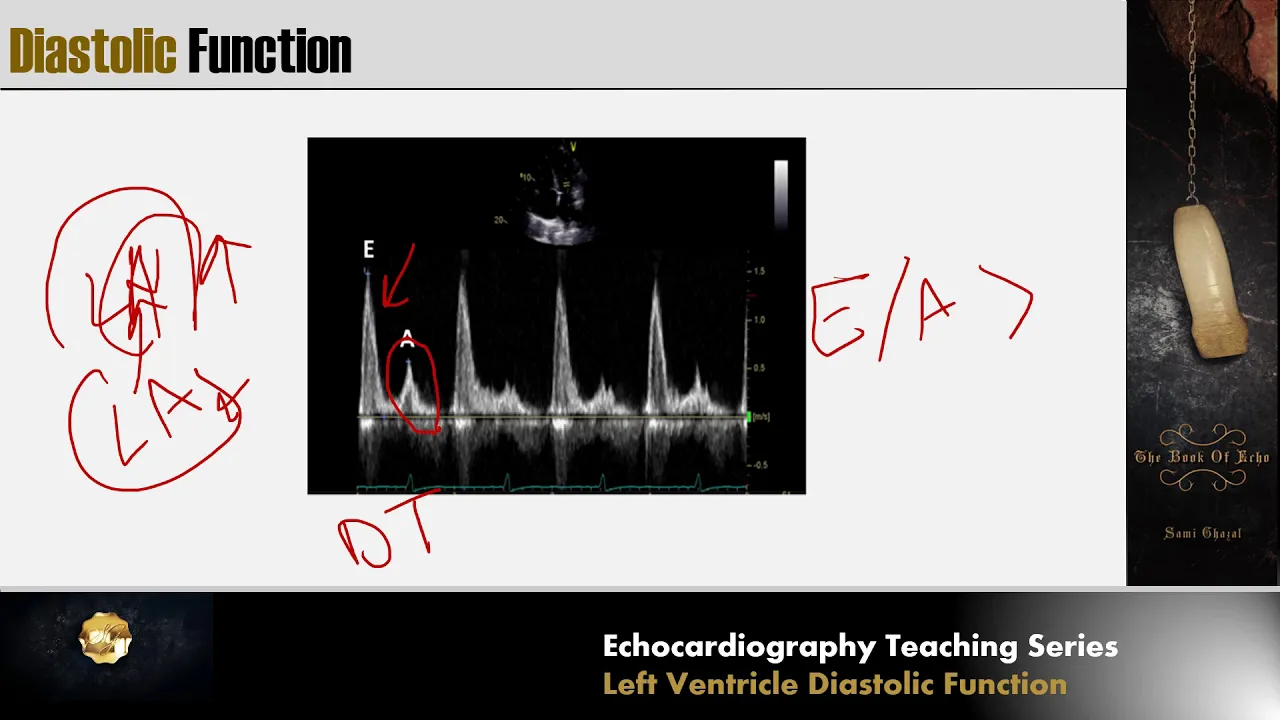
- Prolonged deceleration time of E wave indicates delayed LV relaxation, while increased reliance on atrial contraction leads to a high A wave.
- As diastolic dysfunction worsens, the LV becomes less compliant and filling pressures increase.
New Section
This section discusses the concept of filling pressure in diastolic dysfunction and its implications.
Filling Pressure in Diastolic Dysfunction
- Filling pressure refers to the pressure within the LV during diastole.
- In diastolic dysfunction, as LV relaxation worsens, filling pressure increases. A stiffer LV chamber requires higher pressure to fill.
- The relationship between LV volume and filling pressure is nonlinear. A stiffer chamber produces a greater increase in pressure for a given volume.
The transcript does not provide further content beyond this point.
Diastolic Dysfunction and its Effects on LV and LA Pressure
In this section, the speaker discusses how diastolic dysfunction affects left ventricular (LV) and left atrial (LA) pressure.
Effects of Diastolic Dysfunction on LV and LA Pressure
- Diastolic dysfunction causes a gush of blood from the LA to the LV, resulting in a high E wave.
- This leads to an abnormal E/A ratio and a decrease in relaxation velocity (E prime).
- The increased LA pressure pushes the mitral valve to open early in diastole, reducing isovolumic relaxation time.
- Elevated filling pressure in the LA causes elevated pressure in the pulmonary veins connected to the lungs' vasculature.
- The increased pressure in the right ventricle (RV) results in elevated RV systolic pressure.
- Chronic elevation of LA pressure leads to LA remodeling, causing dilation of the LA.
Filling Patterns and Pressure Equilibrium
This section explains how filling patterns are affected by diastolic dysfunction and discusses pressure equilibrium between LV, LA, and pulmonary veins.
Filling Patterns and Pressure Equilibrium
- During trial relaxation, when L A pressure is high, minimal filling occurs in L A. Most filling happens once the mitral valve opens due to high L A pressure.
- Elevated filling pressures cause elevated pressures during diastole, leading to a short deceleration time.
- Atrial contraction is not sufficient enough to overcome very high LV filling pressures, resulting in an E/A ratio greater than two and a short deceleration time. This pattern is known as restrictive pattern.
Pathophysiology of Diastolic Dysfunction
This section provides a summary of what happens during different stages of diastolic dysfunction.
Pathophysiology of Diastolic Dysfunction
- In normal filling, the E/A ratio is almost equal to or slightly greater than one, with a normal relaxation velocity (E prime).
- In early stages of diastolic dysfunction (grade 1), the E/A ratio decreases, and E velocity increases. The E/E prime ratio becomes reversed.
- As LV filling pressures increase further, there is a restoration of the normal E/A ratio but with low E prime. This pattern is known as pseudo-normal pattern.
- With further increase in LV filling pressures, there is a very high E wave, short deceleration time, and very low relaxation velocity. This results in an E/A ratio greater than two.
Assessing Diastolic Function
This section discusses how to assess diastolic function and determine its severity.
Assessing Diastolic Function
- To determine if diastolic function is normal or abnormal:
- If there is abnormal systolic function or decreased ejection fraction, diastolic function is abnormal.
- Pathological LV hypertrophy also indicates abnormal diastolic function.
- To evaluate the severity of diastolic dysfunction:
- Evaluate mitral inflow peak velocity (E peak velocity), LA volume index, tricuspid peak velocity, septal and lateral relaxation velocities (E prime).
- Calculate the average E/E prime ratio (E divided by E prime). If it is more than 14, diastolic dysfunction is present.
The transcript provided does not cover the complete video content.
Diastolic Dysfunction Evaluation
In this section, the speaker discusses the evaluation of diastolic dysfunction and explains various parameters used to determine its severity.
E to E' Ratio and Lateral Velocity
- The average E to E' ratio is calculated by measuring the septal A velocity and lateral A' velocity.
- If the septal A velocity is less than 7 or the lateral A' velocity is less than 10, it indicates abnormal diastolic function.
- The lateral A' velocity is typically higher than the septal A velocity due to its attachment to a free wall, allowing for more freedom of movement.
Tricuspid Peak Velocity and Left Atrial (LA) Abnormalities
- Tricuspid peak velocity of more than 2.8 is another indicator of abnormal diastolic function.
- An abnormally dilated left atrium (LA) with a volume higher than 34 ml/m² is considered another point towards diastolic dysfunction.
- If three or more points are present (e.g., abnormal E to E' ratio, tricuspid peak velocity > 2.8, dilated LA), it indicates the presence of diastolic dysfunction.
Determining Diastolic Dysfunction Grade
- If two points are present, it suggests grade 1 diastolic dysfunction.
- If one point is positive and three points are negative, it indicates normal diastolic function.
- If two points are positive but one cannot be evaluated for some reason (e.g., inadequate regurgitant flow), it is considered indeterminate based on this algorithm.
Additional Parameters for Diastolic Dysfunction Evaluation
- Other parameters can also be examined to determine if diastolic function is normal or abnormal.
- These include evaluating ejection time (ET), e prime velocity, tricuspid regurgitation peak velocity, and left atrial volume.
- By considering these parameters, the grade of diastolic dysfunction can be determined.
Determining Diastolic Dysfunction Grade Algorithm
- If E to A ratio is less than or equal to 0.8 and E velocity is less than 50 cm/s, it indicates grade 1 diastolic dysfunction.
- If E to A ratio is more than 2, it suggests grade 3 diastolic dysfunction.
- For cases that do not meet the criteria for grade 1 or grade 3, further evaluation is required using additional parameters such as average E to E' ratio, tricuspid velocity, and LA volume.
Examples of Diastolic Dysfunction Evaluation
- Example 1: A patient with acute myocardial infarction and reduced ejection fraction has an E wave peak velocity less than 50 cm/s and an EA ratio less than or equal to 0.8. This indicates grade 1 diastolic dysfunction.
- Example 2: A patient with amyloidosis and concentric hypertrophy has an EI ratio greater than 2. This indicates grade 3 diastolic dysfunction.
- Example 3: A patient with ischemic cardiomyopathy and severe systolic dysfunction has various parameters measured. The results suggest abnormal diastolic function but further evaluation is needed for determining the specific grade.
Timestamps are provided in seconds (s) format.
New Section
This section discusses the assessment of diastolic function and mentions useful parameters that can be used.
Assessment of Diastolic Function
- Velocity is 3.2, indicating grade 1 diastolic dysfunction.
- Volume dilation is another point to consider.
- Average E to E' is not more than 14, so no additional point here.
- Two out of three criteria are met, indicating grade 2 diastolic dysfunction.
Useful Parameters for Diastolic Function Assessment
- A traversal and A wave time difference can be measured in the left atrium and pulmonary vein.
- Measure A wave duration at the level of the annulus using sample volume insertion in the apical four chamber.
- Measure duration of atrial reversal in pulmonary vein and calculate the difference with A wave duration. If it's more than 30 milliseconds, it indicates elevated left ventricular end-diastolic pressure.
- Look into pulmonary veins for reversed ratio (S < D), indicating elevated filling pressure and moving from grade 1 to grade 2.
- Velocity of propagation can be measured by applying a Doppler color sector on the left ventricle covering the mitral valve to apex. Measure slope to determine relaxation quality. If less than 45 cm/s, it indicates impaired relaxation.
New Section
This section discusses velocity of propagation as a parameter for assessing diastolic function.
Velocity of Propagation
- Apply a Doppler color sector from mitral valve to apex and align an A-mode cursor at the center of inflow.
- Plot flow from mitral valve to apex and measure slope.
- Upright slope indicates good relaxation, while tilted slope indicates bad relaxation.
- Velocity of propagation less than 45 cm/s indicates impaired relaxation in depressed ejection fraction.
- Utilize E wave divided by velocity of propagation. If it's more than 2.5, it indicates pulmonary capillary wedge pressure of more than 15 mmHg.
New Section
This section discusses additional parameters for assessing diastolic function, including deceleration time and isovolumic relaxation time.
Additional Parameters
- Measure deceleration time from peak to zero in mitral inflow. If less than 150 milliseconds, it indicates increased left ventricular filling pressure.
- Measure isovolumic relaxation time from end of ejection to beginning of inflow. Align sample volume slightly outside the aortic valve if ejection is not visible.
- Isovolumic relaxation time less or equal to 70 milliseconds indicates elevated left atrial pressure.
- LE wave can be observed during diastasis with high LA pressure. Measure its peak velocity. If more than 20 cm/s, it indicates high LV filling pressure and LA pressure.
- B pump (M-mode parameter) shows elevated LV end-diastolic pressure (>20 mmHg).
The transcript provided does not specify the language used, so I have assumed English for the summary and study notes headings.
Diastolic Function and Filling Pattern
This section discusses the filling pattern of the left atrium (LA) and left ventricle (LV) during normal and straining conditions, as well as the impact on the E/A ratio.
Filling Pattern during Straining
- During straining or Valsalva maneuver, intrathoracic pressure increases, leading to a decrease in systemic venous return.
- The LA filling volume and LV filling volume both decrease during this phase.
- If the E/A ratio decreases by more than 50% during straining, it indicates high LA pressure and high LV filling pressure due to impaired relaxation.
Diastolic Mitral Regurgitation
- Normally, blood flows from the LA to the LV during diastole. However, if the LV filling pressure is higher than LA pressure, diastolic mitral regurgitation can occur.
- Causes of diastolic mitral regurgitation include ventricular paced rhythm, severe aortic regurgitation, and elevated filling pressures.
Pitfalls in Diastolic Function Assessment
- Severe mitral annular calcification can make assessment of diastolic function difficult. The presence of calcification affects the e' velocity measurements in lateral and septal areas.
- Prosthetic material like rings or mechanical valves also hinders accurate assessment using e/e' ratio.
- Mitral stenosis affects trans-mitral velocities and annular relaxation velocities due to degeneration and calcification associated with rheumatic mitral stenosis.
- Obstruction such as tumors or prosthetic valves can alter mitral velocities but not LV filling pressures.
- In severe aortic regurgitation, contamination with aortic regurgitation flow should be avoided when assessing diastolic function.
Fusion between E and A Waves
This section discusses the fusion between E and A waves, as well as the impact on diastolic function assessment.
Fusion between E and A Waves
- Fusion between E and A waves can occur in conditions like tachycardia, first-degree AV block, bundle branch block, or paced rhythm.
- The fusion leads to a shorter diastolic time and overestimation of the A wave.
- If the A wave starts below a velocity of 20, the e/A ratio is still valid despite the fusion.
- An e/A ratio greater than two indicates diastolic dysfunction even with fusion.
Pitfalls in Diastolic Function Assessment (Continued)
This section continues discussing pitfalls in diastolic function assessment.
Challenges in Atrial Fibrillation
- In atrial fibrillation, there is a loss of the A wave, making e/A ratio unusable for assessment.
- Additionally, there are issues with estimating LV diastolic pressure due to the absence of normal filling patterns.
The transcript does not provide further sections or timestamps beyond this point.
New Section
In this section, the speaker discusses the variability in measurements and how to overcome issues related to diastolic dysfunction and atrial fibrillation. They also mention markers of elevated left ventricular (LV) filling pressure.
Variability in Measurements
- The speaker mentions that there can be beat-to-beat variability in measurements.
- To address this issue, they suggest using the average of 5 to 10 beats for both e prime and E prime.
- By averaging multiple measurements, it is possible to overcome the problem of variability.
Diastolic Dysfunction and Atrial Fibrillation
- The speaker explains that ANATEL fibrillation can cause dilation of the left atrium (LA).
- However, LA volume alone may not be indicative of diastolic dysfunction.
- Despite this, it is still possible to estimate LV filling pressure in the presence of atrial fibrillation.
Markers of Elevated LV Filling Pressure
- The speaker suggests utilizing certain markers to estimate LV filling pressure in atrial fibrillation.
- These markers include e to e prime ratio, septal a prime velocity, and more.
- It is important to average these measurements from ten consecutive beats for accurate estimation.
- If there is less variation, averaging three beats may also be sufficient.
New Section
In this section, the speaker concludes their discussion on estimating left ventricular filling pressure. They mention that other parameters can also be used for estimation but caution against assigning specific values without considering other factors.
Estimating Left Ventricular Filling Pressure
- The speaker reiterates that e to e prime ratio and septal a prime velocity are indicative of elevated LV filling pressure.
- Other parameters can also be used for estimation but should not be considered definitive without further evaluation.
- It is important to note that the estimation of LV filling pressure may vary in the presence of atrial fibrillation.
New Section
The speaker concludes the lecture and mentions that the next lecture will focus on right side chamber quantification.
Next Lecture
- The next lecture will cover right side chamber quantification.
- No further details are provided in this section.
Timestamps have been associated with relevant bullet points to help navigate through the transcript.