Gráfica de la función cuadrática o de segundo grado
How to Graph Quadratic Functions
Introduction to Quadratic Functions
- The video introduces the concept of graphing quadratic functions, emphasizing that their graphs are parabolas that can open either upwards or downwards.
Visual Representation of Parabolas
- The instructor sketches several parabolas: those in red open downwards, while those in blue open upwards. This distinction is crucial for understanding how to graph them accurately.
Importance of the Vertex
- A key point made is the necessity of plotting the vertex when graphing a parabola, as it represents the center of the curve. Understanding its position helps in determining other points on the graph.
Finding the Vertex
- To find the vertex's x-coordinate, use the formula -b/(2a). The instructor encourages viewers to refer back to previous videos for a deeper understanding of this calculation.
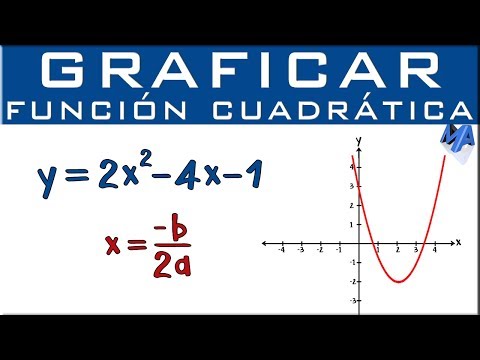
Example Function Analysis
- An example function y = 2x^2 - 4x - 1 is introduced, and steps are outlined for finding its vertex by identifying coefficients a, b, and c. Here, a = 2, b = -4, and c = -1.
Calculating Vertex Coordinates
- The x-coordinate of the vertex is calculated as follows:
- Substitute values into -(-4)/(2*2) which simplifies to 4/4 = 1.
- This indicates that the vertex lies at x = 1 on the graph.
Creating a Value Table
- A value table is recommended with at least five points centered around x = 1 (the vertex). Suggested values include numbers both above and below this central point: -1, 0, 1, 2, and 3. This approach aids in visualizing how y-values change around the vertex.
Substituting Values into Function
- The process begins by substituting each chosen x-value into the function:
- For instance, starting with x = -1 leads to calculating y using substitution into y = 2x^2 - 4x - 1. Each step involves evaluating powers and performing arithmetic operations systematically.
This structured approach ensures clarity in understanding how quadratic functions behave and how their graphs can be constructed effectively through careful calculations and plotting techniques.
Understanding Quadratic Functions and Their Graphs
Exploring the Basics of Quadratic Equations
- The discussion begins with calculating powers and multiplications, emphasizing that zero squared is still zero. The speaker notes that multiplying by zero yields no change in value.
- When substituting values into the equation, the speaker illustrates how to handle calculations involving squares and multiplication, specifically using 1 as a test value.
- The outcome when x equals 1 results in -3. The speaker highlights that if the vertex (the peak or trough of a parabola) is an integer, it simplifies finding symmetrical points on either side.
Vertex and Symmetry in Parabolas
- The vertex serves as the center of symmetry for parabolas; thus, points equidistant from the vertex will yield equal y-values.
- Continuing with calculations for x = 2 shows that it also results in -1, reinforcing the concept of symmetry around the vertex found earlier.
- By testing x = 3, it confirms another point at y = 5. This consistency across calculated points demonstrates how integer vertices maintain symmetry.
Graphing Quadratic Functions
- Key points are plotted: (1, -3), (0, -1), (-1, 5), (2, -1), and (3, 5). These coordinates illustrate how parabolas rise or fall based on their vertex position.
- Emphasizing again that symmetrical properties hold true only when dealing with integer values; fractional inputs may disrupt this balance leading to different outputs.
Practical Application and Exercises
- A reminder is given about graphing techniques; students should practice plotting quadratic functions to solidify understanding of concepts discussed.
- An exercise is suggested where viewers can pause to try graphing a specific quadratic function themselves using provided formulas for guidance.
Coefficients and Their Impact on Graph Shape
- Discussion shifts to coefficients within quadratic equations. It’s noted that coefficients directly influence graph shape—specifically identifying key numbers associated with each term in standard form.
- The formula for finding x-values is introduced: x = -b/2a. This formula helps locate the vertex efficiently by substituting known coefficients into it.
- As examples are worked through step-by-step for various x-values like 1 and 2, consistent outcomes reinforce previous findings regarding symmetry around integer vertices.
Conclusion and Further Learning Opportunities