5.3. Ejemplo de Regresión Lineal Simple
Linear Regression Example
Introduction to Simple Linear Regression
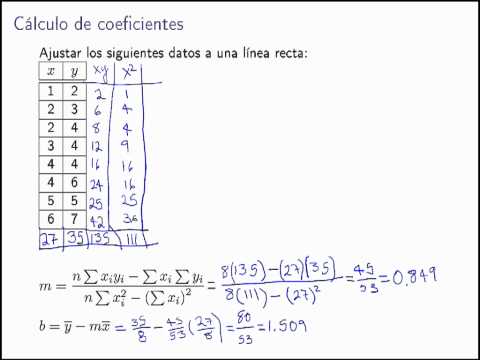
- The discussion begins with an example of simple linear regression, focusing on fitting a set of data points to a straight line.
- The provided data points for X are: 1, 2, 2, 3, 4, 4, 5 and for Y: 6, 2, 3, 4, 4, 4, 6.
Calculating Products and Sums
- A new column is created that represents the product of X and Y values; calculated products include: 2 (16), 8 (24), etc.
- The squares of X values are also computed resulting in: 1^2 =1, 2^2 =4, 3^2 =9, etc.
- Summations yield totals for each column: Sum of X is 27, Sum of Y is 35, Sum of XY is 135, and Sum of X² is 111.
Applying the Formulas
- Substituting into the formulas where n = number of data points (8):
- [ m = fracn(textSum(XY)) - (textSum(X)(textSum(Y)))n(textSum(X^2)) - (textSum(X))^2 ]
- Results in m approx 0.849 .
- For calculating b (y-intercept):
- Formula used: b = barY - m cdot barX
- Resulting value for b is approximately 1.509.
Graphing the Results
- Points are plotted on a graph based on calculated coordinates from earlier steps.
- The equation derived from the regression line approximates to:
- y = mx + b
- With specific values leading to predictions at given x-values.
Conclusion and Next Steps